All hopes are on the Central Banks | Luminor

All hopes are on the Central Banks
- Global equities have posted the first monthly decline this year
- Trade war has escalated significantly hurting investor sentiment
- Global economic slowdown continues as negative effects of trade war start to show up
- Political uncertainty puts additional pressure on the European equities
- Investors now expect significant monetary easing from the central banks
- Despite global equities being fairly priced in terms of valuation, short term risks remain elevated
First negative month for global stocks this year
Global equity winning streak has ended in May as most major equity markets declined for the month. This was the first negative monthly return for world equities this year. All Country World index declined 5.7% for the month amid increased volatility.
Chinese equities were leading the move down plunging over 13% in May and dragging the whole Emerging Asia equity index down 8.6%. As a result, Emerging market equities as whole suffered more than equities in developed countries.
On the other hand, Eastern European stocks stood out, as they managed to post a gain of 1.5% for the month. Led by Russian equity market the year-to-date gain of the Eastern European equity index increased to over 15%.
Equity Market Performance
| 1m | YTD 2019 | Distance from all-time high | |
|---|---|---|---|
| Developed Markets ex US (EUR) | -4,9% | 8,4% | 11,0% |
| All Country World Index (EUR) | -5,7% | 10,8% | 5,7% |
| Europe (EUR) | -5,7% | 9,0% | 11,6% |
| Emerging Markets (EUR) | -7,0% | 6,0% | 11,1% |
| S&P 500 (USD) | -6,6% | 9,8% | 6,6% |
* - based on monthly data
Source: MSCI, finance.yahoo.com
As investors fled risky assets many were moving into safe bonds bidding their prices up. Consequently, global bond yields continued dropping in May. The biggest move was in the US yields, which led the US 2-year Treasury yield below 2% in the beginning of June. At the same time 10-year US Treasury yield dropped to the lowest level since September 2017 (2.08%).
Commodity prices were also under pressure in May leading to a 8.2% decline in the S&P Goldman Sachs Commodity index (USD). Oil was the biggest loser, as prices for WTI crude oil plunged 16.3% for the month. Nevertheless, Crude oil prices were still up over 16% since the beginning of the year.
Trade tensions have escalated significantly
Escalation of trade war between US and China was once again the trigger for the equity market sell-off. As the trade talks broke down in early May, US and China moved forward with introducing additional reciprocal tariffs.
However the escalation didn’t stop there and specific companies got targeted.
First Trump administration has blacklisted China’s technology giant Huawei essentially prohibiting US companies to do any business with it. These actions caused significant problems for Huawei and led to retaliation by China. As a result, China started an investigation of FedEx for “undermining the legitimate rights and interests” of Chinese clients. Moreover, China is threatening to limit rare earth element export to the US. As these elements are essential inputs in many industries, banning their export would be a significant blow to the US economy.
Additionally, investors’ sentiment is being hampered not only by the potential economic effects of the trade war but also by the unpredictability of President Trump’s actions. In an unexpected move late in May, Trump has announced a potential 5% tariff on all Mexican imports starting from 10th of June if they don’t deal with the immigrant flow. And although Trump has called off his threat in early June, which led to a significant rebound in global equities, such unpredictability causes increased uncertainty hurting investor confidence.
Negative effects of trade war are starting to appear in the recent economic data
Meanwhile negative effects of the trade wars are starting to show up in the latest economic indicators data. After some improvement in April, global Purchasing Managers Index (PMI), which provides advanced indication of what is really happening in the economy, has once again turned down. Manufacturing PMI has actually dropped below 50, indicating contraction in manufacturing activity.
Summary economic indicator
| Value | 1 month change | 1 year change | |
|---|---|---|---|
| Global Manufacturing PMI | 49,8 | -0,6 | -3,2 |
| Global Services PMI | 51,6 | -1,2 | -2,7 |
| Global Composite PMI | 51,2 | -1,0 | -2,8 |
| OECD Composite Leading Indicator | 99,3 | 0,0 | -0,9 |
Source: Bloomberg, OECD.org
Moreover, most of the economic indicators reported lately were below analyst expectations. Even the US economy, which stayed strong before, has recently started showing some signs of slowing. The latest job market data showed that the US economy created only 75 000 new jobs in May versus an expectation of 180 000.
At the same time copper price action confirms damage done to the emerging market economies. As industrial sector plays a major role in the emerging market economies, copper prices have historically been a good indicator of emerging market equities’ performance relative to developed markets. Consequently, the recent downtrend in copper prices implies that emerging markets could be bearing the biggest negative impact of the trade war escalation.
Copper price and emerging market equities move together
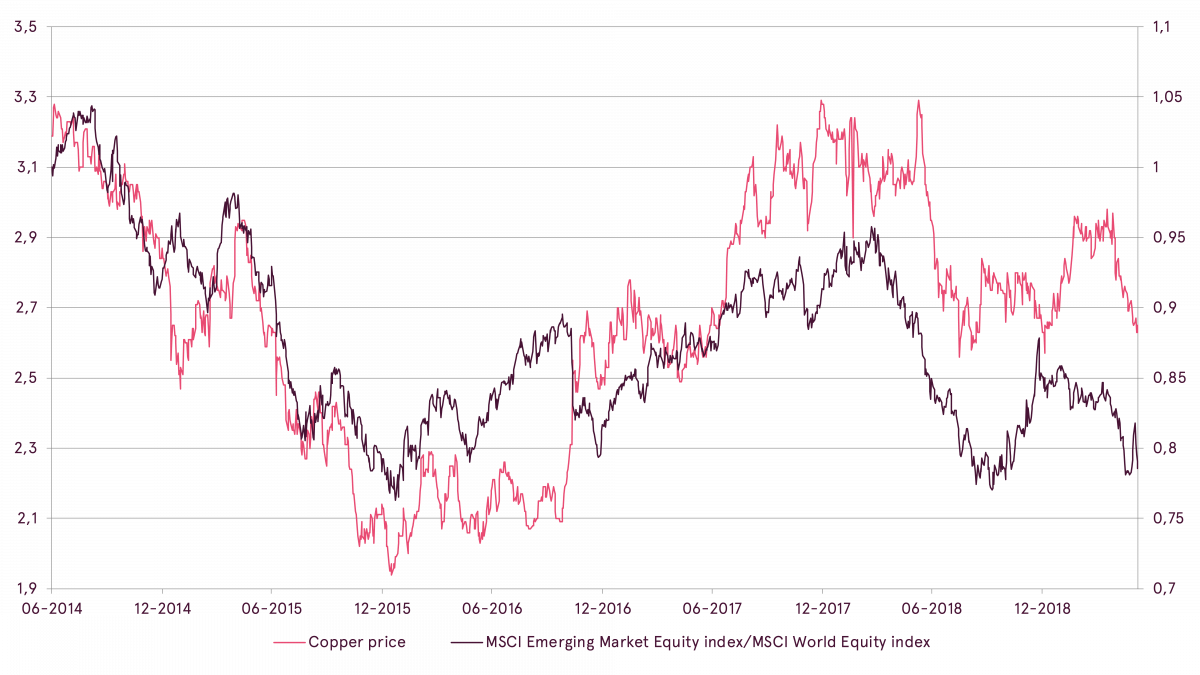
Source: MSCI, Bloomberg
Political uncertainty in Europe is an additional burden on investor sentiment
European region is also heavily affected by the trade war as many European countries are largely export-oriented. As a result, a decline in global trade amplified the extent of the already ongoing economic slowdown in the region.
Making things worse for Europe is the growing political uncertainty in the region. First, the uncertainty over Brexit has grown after Theresa May’s resignation, which led to a search for the new Prime Minister. As the probability of Boris Johnson becoming the next PM increases, chances of no-deal Brexit also grow. This erodes business confidence, reduces investments and hampers overall sentiment.
Secondly, market worries towards Italy have also increased lately, as political uncertainty continues growing. As the popularity of the Eurosceptic Salvini grows, also grows the probability of a break in the current coalition and new elections. Investors fear that with Salvini as Prime Minister there could be a risk of Italy leaving the Euro area, as he is supporting the idea of Italy introducing a parallel currency. Consequently, increased political uncertainty is reversing the small rebound in growth witnessed in the first quarter of this year.
All hopes on are on the Central Banks
With the projected continuation of economic slowdown and lowered growth estimates also the inflation expectations are getting hammered. The survey of professional forecasters conducted by the ECB shows that both short and long-term Eurozone inflation expectations continued decreasing and are back at 2017 year-end levels. The market estimate of US 5-year inflation 5 years from now, a gauge of long term inflation expectations used by the Fed, dropped below 2%, a level last seen 2 years ago.
ECB survey of professional forecasters (SPF)
| Current calendar year | Next calendar year | Calendar year after next | One year ahead | Two years ahead | Five years ahead | |
|---|---|---|---|---|---|---|
| Inflation expectations in Q2 2018* | 1,5% | 1,6% | 1,7% | 1,6% | 1,7% | 1,9% |
| Inflation expectations in Q2 2019* | 1,4% | 1,5% | 1,6% | 1,5% | 1,6% | 1,8% |
* - Inflation is defined as the year on year percentage change in the euro area all items Harmonised Index of Consumer Prices (HICP), as published by Eurostat.
Source: ECB
As a result of dropping inflation expectations, slowing growth and increased uncertainty, the expectations of additional easing by the global central banks have grown significantly. Despite euro rates already being negative investors have been pricing an additional 0.1 percentage point cut. The decision of the ECB Governing Council at its last meeting on the 6th of June, however, has slightly disappointed investors. Although the ECB promised to keep interest rates unchanged for 6 months longer (at least until end of first half of 2020), the terms of the new loan refinancing facility were tightened. Consequently, the overall message from the ECB was less supportive than expected.
US long term inflation expectation
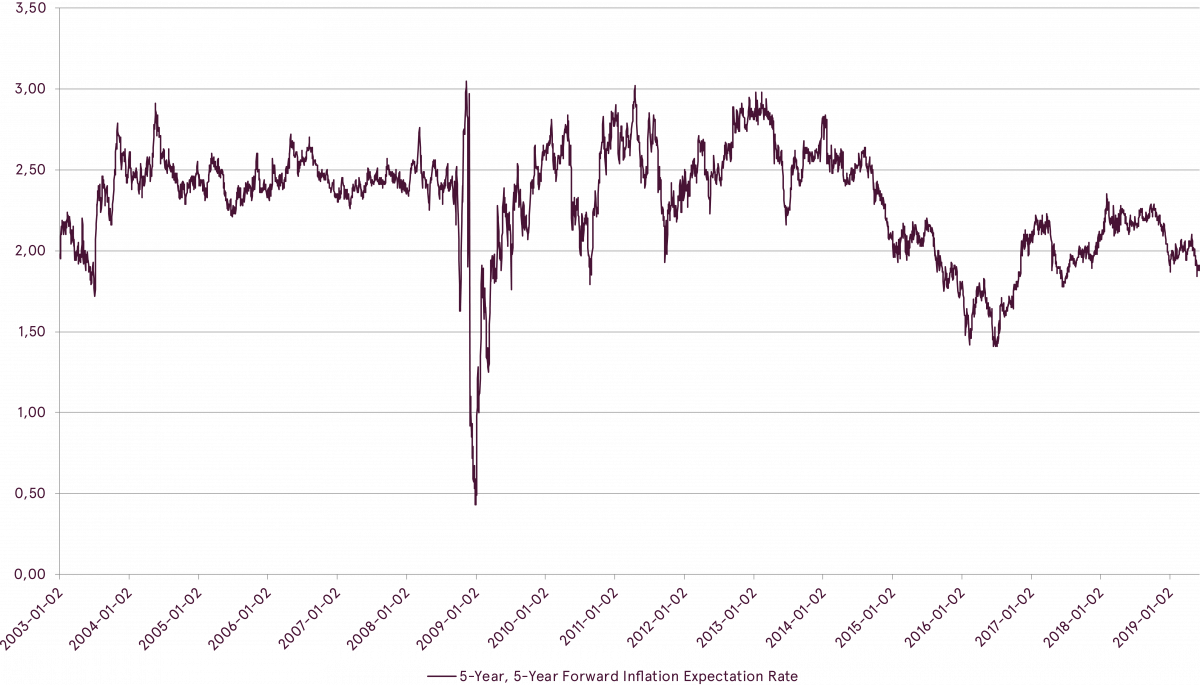
Source: fred.stlouisfed.org
On the other hand market expectations of the Fed rate cuts continued growing. Currently the market expects a total of 1 percentage point of cuts until the end of next year. Moreover, the market assigns a 75% probability of the first rate cut happen already at July meeting. With such magnitude of rate cuts already priced in it would be really hard for the Fed to provide additional positive surprise to the market. Therefore there is some chance of a negative surprise if inflation expectations and economic growth rebound and there is no need for the Fed to cut rates so much.
As the Feds starts its easing cycle the ECB, being already at a negative interest rate, will most likely end up lagging the easing pace of the Fed. As a result, the interest rate differential will move more in favor of the EUR, supporting the currency. This factor has been behind the recent move higher in the EUR/USD exchange rate above 1.13 level. Moreover, lower USD interest rate would put pressure on the dollar against other currencies, making monetary conditions more accommodative also for emerging market economies.
Outlook
Global equity markets have started June on a positive note in the light of growing expectations for interest rate cuts. Very pessimistic investor sentiment in the beginning of June helped support the rebound, as global equity markets got oversold in the short-term perspective. However, going forward the risks to the outlook remain elevated.
Even if the Fed proceeds with the interest rate cuts according to the market expectations the implication for global stocks is not so straightforward. Historically, equity market performance after the first rate cut by the fed was mixed. On average the US equity market has risen just 0.4% during the year after the first rate cut, while the rage of the outcomes was very wide.
Performance of S&P 500 index around 1st rate cut in the cycle by the Fed
| -12m | -6m | -3m | -1m | Date of the first rate cut | 1m | 3m | 6m | 12m |
|---|---|---|---|---|---|---|---|---|
| 9,2% | 1,1% | -1,6% | -3,1% | 1989-06-06 | 2,5% | 6,4% | 12,1% | 5,8% |
| 9,7% | 11,0% | 5,8% | 1,1% | 1995-07-06 | 1,9% | 2,4% | 8,3% | 12,1% |
| -1,6% | -10,2% | -10,0% | 1,2% | 1998-09-29 | 4,8% | 17,9% | 21,9% | 24,2% |
| -14,8% | -12,4% | -6,1% | 1,4% | 2001-01-03 | 0,8% | -16,2% | -10,8% | -16,5% |
| 18,4% | 9,0% | -1,8% | 6,3% | 2007-09-18 | 5,9% | -0,6% | -9,3% | -23,9% |
| 4,2% | -0,3% | -2,7% | 1,4% | Average | 3,2% | 2,0% | 4,4% | 0,4% |
Source: fred.stlouisfed.org, finance.yahoo.com
Therefore, as long as political and geopolitical uncertainty remains, global equity markets will likely remain volatile. Moreover, as investors still expect eventual resolution to the trade issues and a rebound in economic growth, it is very important that US and China reach an agreement on trade before the end of this year.
From the valuation perspective global equities are currently trading at their long term average levels, implying that long term expected return should also be around the average levels. At the same time wider price fluctuations are to be expected in the short term due to elevated risks.

Anton Skvortsov
Investment Advice Development Manager in Baltics
Warnings:
- This Marketing Communication is not considered investment research and has not been prepared in accordance with standards applicable to independent investment research.
- This Marketing Communication does not limit or prohibit the bank or any of its employees from dealing prior to its dissemination.
Origin of the Marketing Communication
This Marketing Communication originates from Portfolio Management unit (hereinafter referred to as PMU) – a division of Luminor Bank AS (reg. No 11315936, with registered address at Liivalaia 45, 10145, Tallinn, Republic of Estonia, hereinafter - Luminor). PMU is involved in the provision of discretionary portfolio management services to Luminor clients.
Supervisory authority
As a credit institution Luminor is subject to supervision by the Estonian financial supervision and resolution authority (Finantsinspektsioon). Additionally, Luminor is subject to supervision by the European Central Bank (ECB), which undertakes such supervision within the Single Supervisory Mechanism (SSM), which consists of the ECB and the national responsible authorities (Council Regulation (EU) No 1024/2013 - SSM Regulation). Unless set out herein explicitly otherwise, references to legal norms refer to norms enacted by the Republic of Estonia.
Content and source of the publication
This Marketing Communication has been prepared by PMU for information purposes. Luminor will not consider recipients of this Communication as its clients and accepts no liability for use by them of the contents, which may not be suitable for their personal use.
Opinions of PMU may deviate from recommendations or opinions presented by the Luminor Markets unit. The reason may typically be the result of differing investment horizons, using specific methodologies, taking into consideration personal circumstances, applying a specific risk assessment, portfolio considerations or other factors. Opinions, price targets and calculations are based on one or more methods of valuation, for instance cash flow analysis, use of multiples, behavioural technical analyses of underlying market movements in combination with considerations of the market situation, interest rate forecasts, currency forecasts and investment horizon.
Luminor uses public sources that it believes to be reliable. However, Luminor has not performed independent verification. Luminor makes no guarantee, representation or warranty as to their accuracy or completeness. All investments entail a risk and may result in both profits and losses.
This Marketing Communication constitutes neither a solicitation of an offer nor a prospectus in the sense of applicable laws. An investment decision in respect of a financial instrument, a financial product or an investment (all hereinafter “product”) must be made on the basis of an approved, published prospectus or the complete documentation for such a product in question and not on the basis of this document. Neither this document nor any of its components shall form the basis for any kind of contract or commitment whatsoever. This document is not a substitute for the necessary advice on the purchase or sale of a financial instrument or a financial product.
No Advice
This Marketing Communication has been prepared by Luminor PMU as general information and shall not be construed as the sole basis for an investment decision. It is not intended as a personal recommendation of particular financial instruments or strategies. Luminor accepts no liability for the use of the Marketing Communication content by its recipients.
If this Marketing Communication contains recommendations, those recommendations shall not be considered as an objective or independent explanation of the matters discussed herein. This document does not constitute personal investment advice or take into account the individual financial circumstances or objectives of the persons who receive it. The securities or other financial instruments discussed herein may not be suitable for all investors. The investor bears all risk of loss in connection with an investment. Luminor recommends that investors independently evaluate each issuer, security or instrument discussed herein and consult any independent advisors if they believe it necessary.
The information contained in this document also does not constitute advice on the tax consequences of making any particular investment decision. The estimates of costs and charges related to specific investment products are not provided therein. Each investor shall make his/her own appraisal of the tax and other financial advantages and disadvantages of his/her investment.
Risk information
The risk of investing in certain financial instruments, including those mentioned in this document, is generally high, as their market value is exposed to many different factors. The value of and income from any investment may fluctuate from day to day as a result of changes in relevant economic markets (including changes in market liquidity). The information herein is not intended to predict actual results, which may differ substantially from those reflected. Past performance is not necessarily indicative of future results. When investing in individual financial instruments the investor may lose all or part of their investments.
Important disclosures of risks regarding investment products and investment services are available here.
Conflicts of interest
To avoid occurrence of potential conflicts of interest as well as to manage personal account dealing and / or insider trading, the employees of Luminor are subject to the internal rules on sound ethical conduct, management of inside information, and handling of unpublished research material and personal account dealing. The internal rules have been prepared in accordance with applicable legislation and relevant industry standards. Luminor’s Remuneration Policy establishes no link between revenues from capital markets activity and remuneration of individual employees.
The availability of this Marketing Communication is not associated with the amount of executed transactions or volume thereof.
This material has been prepared following the Luminor Conflict of Interest Policy, which may be viewed here.
Distribution
This Marketing Communication may not be transmitted to, or distributed within, the United States of America or Canada or their respective territories or possessions, nor may it be distributed to any U.S. person or any person resident in Canada. The document may not be duplicated, reproduced and(or) distributed without Luminor’s prior written consent.