Lithuania: Swimming against the tide, but for how long? | Luminor

Žygimantas Mauricas, Luminor Chief Economist | © Delfi.lt
Žygimantas Mauricas, Luminor Chief Economist
Key highlights
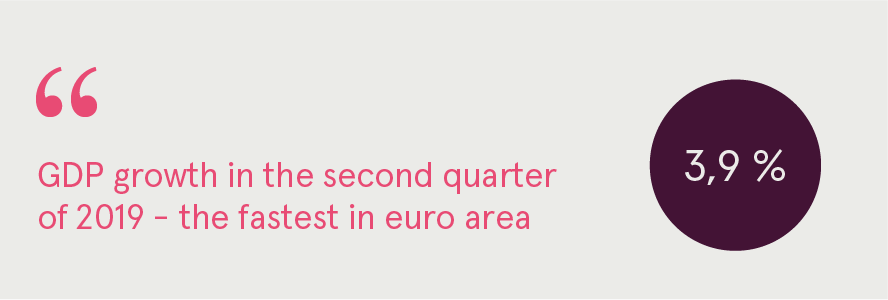
- Lithuanian economy performed exceptionally strong in the first half of 2019, but growth will slow down
- Increasing global uncertainties and re-emerging domestic imbalances prompts us to lower GDP growth forecasts for 2020 and 2021 to 2.6% and 2.3% respectively
- Under the baseline scenario, recession will be avoided, but high dependence on cyclical economic sectors (transport, manufacturing and construction) may exacerbate economic slowdown in case of less favourable growth scenario
- Export growth will slow down, but remain in positive territory, thanks to a recent influx of foreign direct investments in high-tech manufacturing and service sectors
- Investment growth is primarily driven by public sector investments, while private sector investment growth is slowing down
- Inflationary pressures are rising again, which may dampen consumer confidence and slow private consumption growth. Prices of services and food items are rising at the fastest pace in the euro area
- Private sector wage growth slowed down to 6.8% in the first half of 2019 and is expected to moderate towards 4-5% in 2020 and 2021
- Public sector wage growth, on the contrary, accelerated sharply to 12.8% and is expected to remain the key driver for an overall increase in wage levels
- Unemployment rate increased for the first time since 2011. Inflow of migrants from third countries (Ukraine and Belarus) and weak job creation in manufacturing and transport sectors are the main causes behind an increase
- Failure to implement public sector reforms coupled with generous commitments to increase public sector wages may become a real burden on public finances once economic cycle turns and growth slows down
- Lithuania is in substantially more favourable position to cope with potential economic slowdown compared to 10 years ago, hence even if unfavourable economic scenario materializes, economic recession will likely be avoided or will be limited in scope
- Key risks stem from external environment, since post-crisis export-driven recovery made Lithuania an increasingly open economy, dependent on the health of and access to external markets, especially the EU
Four threats going into slower economic growth cycle
Lithuanian economic growth remains exceptionally strong, but as the external environment becomes increasingly cloudy we would like to stress four unfavourable developments, which may limit economic growth in 2020 and 2021.
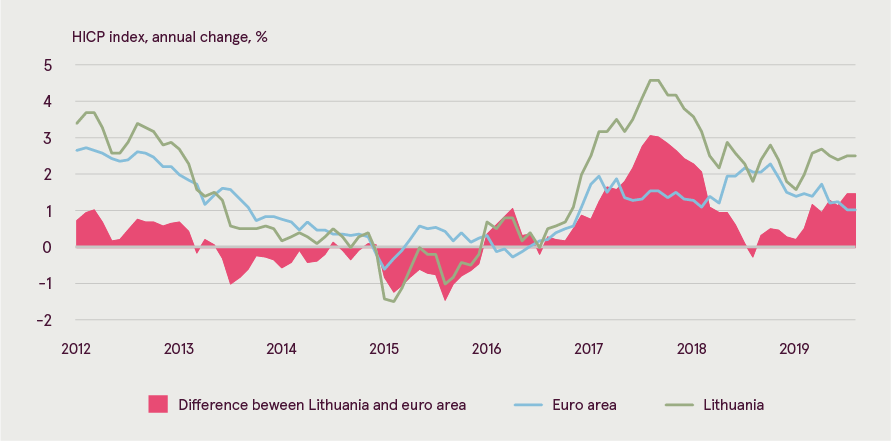
- Re-emerging inflationary pressures. Lithuanian government prematurely announced the victory in its fight against food price increases in February 2019. Food price inflation accelerated sharply ever since and reached 5.9% in July - the highest in the euro area. The jump is reminiscent to the one observed in end-2017, when food price inflation jumped to 6.0% negatively affecting consumer confidence and retail trade growth volumes. Although there are several supply-side factors (e.g. bad vegetable harvest, swine fever) explaining a recent jump in food prices, the key driving force is re-emerging domestic inflationary pressures. This is evidenced by re-acceleration of service price inflation, which remains the highest in the European Union.
Re-emerging inflationary pressures could reignite a vicious price-wage spiral as employees will demand greater increases in wages to compensate the loss in purchasing power. This, in turn, could deteriorate Lithuania’s international competitiveness and put pressure on public finances.
On a positive note, overall inflation remains within a range of 2-3% due to falling energy prices and subdued growth of goods prices. We expect global energy and commodity prices to remain low, hence we forecast overall inflation level to remain within 3% range in 2020.
Inflation pressures are re-emerging
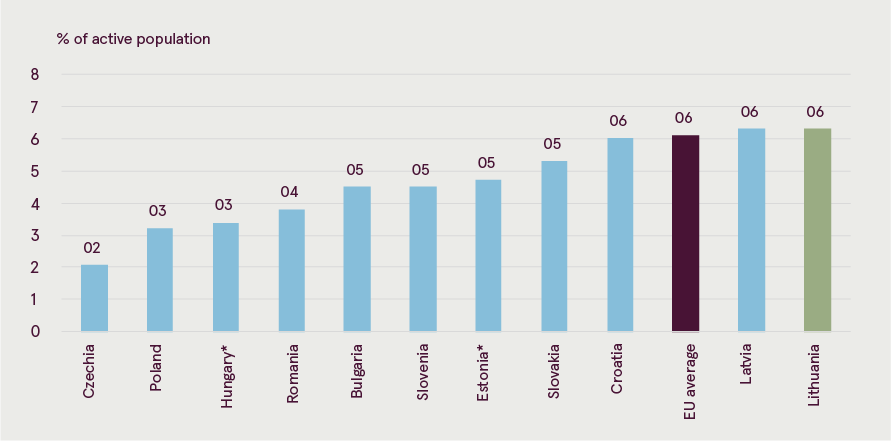
- Rising unemployment rate. Unemployment rate in July 2019 jumped to 6.3% and was 0.7 p.p. higher compared to July 2018, when it stood at 5.6%. This is at odds with employment growth data, which shows a continuous, albeit somewhat slower, increase in the first two quarters of 2019. This suggests that an increase in unemployment was primarily caused by increased immigration from third countries (primarily Ukraine and Belarus), which are crowding out local employees. The argument is supported by the fact that in 2019 Q2 the highest increase in unemployment rate was observed among males living in the cities (+0.7 p.p.) – exactly the places where most immigrants settle. Female unemployment increased only marginally (+0.1 p.p.) and fell further among males living in rural areas (-0.5 p.p.). Rising unemployment rate may risk further increasing income inequalities and undermine long-term human capital creation, since an influx of cheap labour from third countries may limit motivation to invest in the development of local human capital. Another reason of increased unemployment among males is weak job creation in manufacturing and transport sectors – industries traditionally dominated by males and most exposed to negative global trade developments.
Another worrying development is that despite exceptionally strong GDP growth, unemployment rate in Lithuania is still above EU average and the highest among all CEE and Baltic countries. Once economic cycle turns and growth slows down, unemployment rate can easily approach double-digit levels, which could increase emigration, income inequality and fiscal burden. On a positive note, labour costs in Lithuania remain the third-lowest in the EU (just above Bulgaria and Romania), hence Lithuania remains attractive for FDI’s, which may alleviate pressure on unemployment.
Unemployment rate in Lithuania is above EU average despite exceptionally strong GDP growth
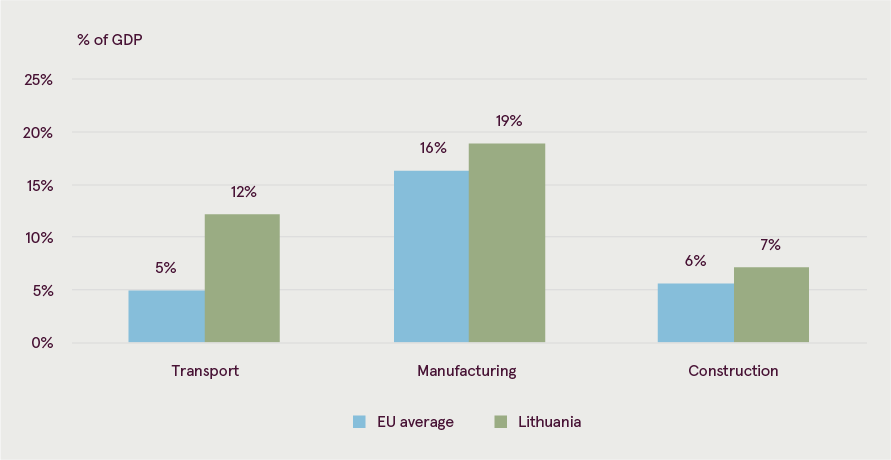
- High dependence on cyclical economic sectors. Transport, manufacturing and construction sectors in Lithuania account for a larger share of GDP compared to EU average. These sectors are more cyclical in nature and tend to be more vulnerable to economic downturns, hence potentially exacerbating an overall fall in economic activity.
Lithuanian transport sector is of particular concern. Firstly, it is directly exposed to an ongoing slowdown in international trade. Secondly, increasing protectionism within the European Union and adverse regulatory changes at the EU-wide level (e.g. Mobility Package I) may limit export growth of transport services to the West or prompt some Lithuanian transport companies to relocate operations to other jurisdictions within the EU. Thirdly, weak economic growth of Russia, economic sanctions and pursued policy of income-substitution limit service export potential to the East. Finally, accounting for more than 12% of Lithuanian GDP (the highest share in the EU), 12% of total investment volumes and 14% of overall exports, transport sector could have substantial negative effect on overall economic performance in case of economic downturn.
Cyclical economic sectors dominate Lithuanian economy
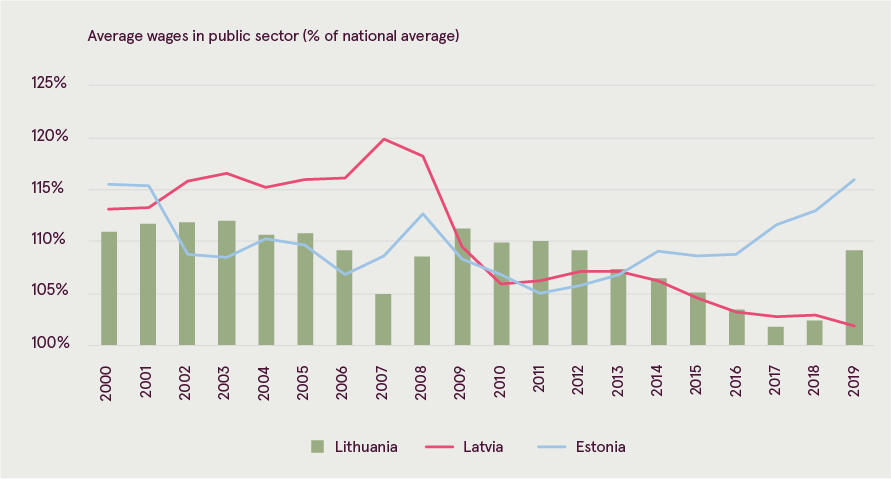
- Failure to implement public sector reforms. Lithuanian government to a large extent failed to implement much needed public sector reforms, especially in education and healthcare sectors. Instead, it made generous commitments to increase wages for public-sector employees at a time when economic growth prospects get cloudy. In the first half of 2019, wages for public-sector employees increased by 12.8% - significantly higher than 6.8% observed in private sector.
The willingness to increase public-sector wages is understandable, since growth in public sector wages lagged behind private sector wage growth during the post-crisis belt-tightening period. However, the main reason for low public sector wages is not the lack of overall financing (Lithuania spends 9.8% of GDP on public sector wages vis-à-vis 9.9% EU average), but huge inefficiencies within public sector. Education and healthcare sectors are notorious examples: overall wage bill for those sectors is well above the EU average (5.3% vs. 4.8% of GDP respectively), but average wage levels are dismal, prompting employees to work part-time in private sector, thus further reducing efficiency of public sector. Hence, an increase in public sector wages should be tightly linked with efficiency enhancing reforms. Otherwise, inefficient and expensive public sector may become a real burden on public finances once economic cycle turns and growth slows down.
Lithuania has very limited fiscal space to increase public sector wages. Firstly, poor tax compliance (e.g. VAT-gap is estimated to be more than 20%) and legal tax breaks prevents Lithuania from increasing budget revenues (budget revenue to GDP ratio is the second lowest in the EU). Secondly, exceptionally low spending on social security (second lowest in the EU) limits effective reduction of poverty, inequality and social exclusion. In times of economic slowdown, social spending needs increase dramatically (e.g. during the 2008-2009 economic crisis it increased from 10.7 to 16.4% of GDP), hence leaving no fiscal space for public sector wage increases. Hence, without increasing public sector efficiency, it is unlikely that increase in public sector wages is sustainable.
Public sector wages lagged behind the private sector ones during the post-crisis belt-tightening period
This time will be different
Even if less favourable economic growth scenario materializes, this time Lithuania is in substantially more favourable position to cope with potential economic slowdown when it was 10 years ago. Lithuania has no visible internal or external imbalances: public and private debt levels are exceptionally low and there are no credit nor inflationary or real estate bubbles. Belt-tightening policies implemented during the post-crisis period, influx of foreign direct investments and more broad-based growth transformed Lithuania from one of the most vulnerable to one of the most resilient regions in the EU. Yet export-driven recovery also made Lithuania increasingly open economy, dependent on the health of and access to external markets. An ongoing trade war between China and the USA, which sparked protectionism ideas around the world, sanctions war with Russia as well as emerging market weakness also made it increasingly dependent on the EU, hence economic performance of Lithuania to a large extent will depend on economic health and geopolitical stability and unity of the single market.
We thus expect economic slowdown to be limited with an outright recession likely to be avoided. Export growth is expected to moderate, but a recent influx of foreign direct investments in high-tech manufacturing and service sectors, should keep export growth in positive territory. Longer-term growth potential will very much depend on how successful Lithuania will be in implementing productivity-enhancing reforms in public sector, improving tax compliance, reducing income inequalities and continuing attracting human, physical financial capital, which would facilitate an ongoing income convergence with the West.
Lithuania: Macroeconomy indicators
(% annual real changes unless otherwise noted)
|
|
2016 |
2017 |
2018 |
2019F |
2020F |
2021F |
|
Real GDP, % y/y |
2.4 |
4.1 |
3.5 |
3.6 |
2.6 |
2.3 |
|
Private consumption |
2.4 |
4.1 |
3.5 |
4.0 |
3.2 |
2.8 |
|
Fixed investment |
0.3 |
6.8 |
6.5 |
7.0 |
4.0 |
4.0 |
|
Exports |
4.0 |
13.6 |
5.1 |
6.0 |
3.0 |
3.0 |
|
Unemployment rate, % |
7.9 |
7.1 |
6.2 |
6.3 |
6.6 |
6.8 |
|
Consumer prices, % y/y |
0.7 |
3.7 |
2.5 |
2.6 |
2.2 |
2.0 |
|
Gross monthly wages, % y/y |
7.9 |
8.2 |
10.0 |
8.0 |
6.0 |
5.0 |
Making banking delightfully easy
